Built by a quant and a trader

Test Your Trading Edge Like a Quant

Built by a quant and a trader, tradovera helps you journal trades, measure execution quality, test model confluences, and discover what actually drives your P&L.
Free to start
FTMO & Apex ready
For discretionary traders
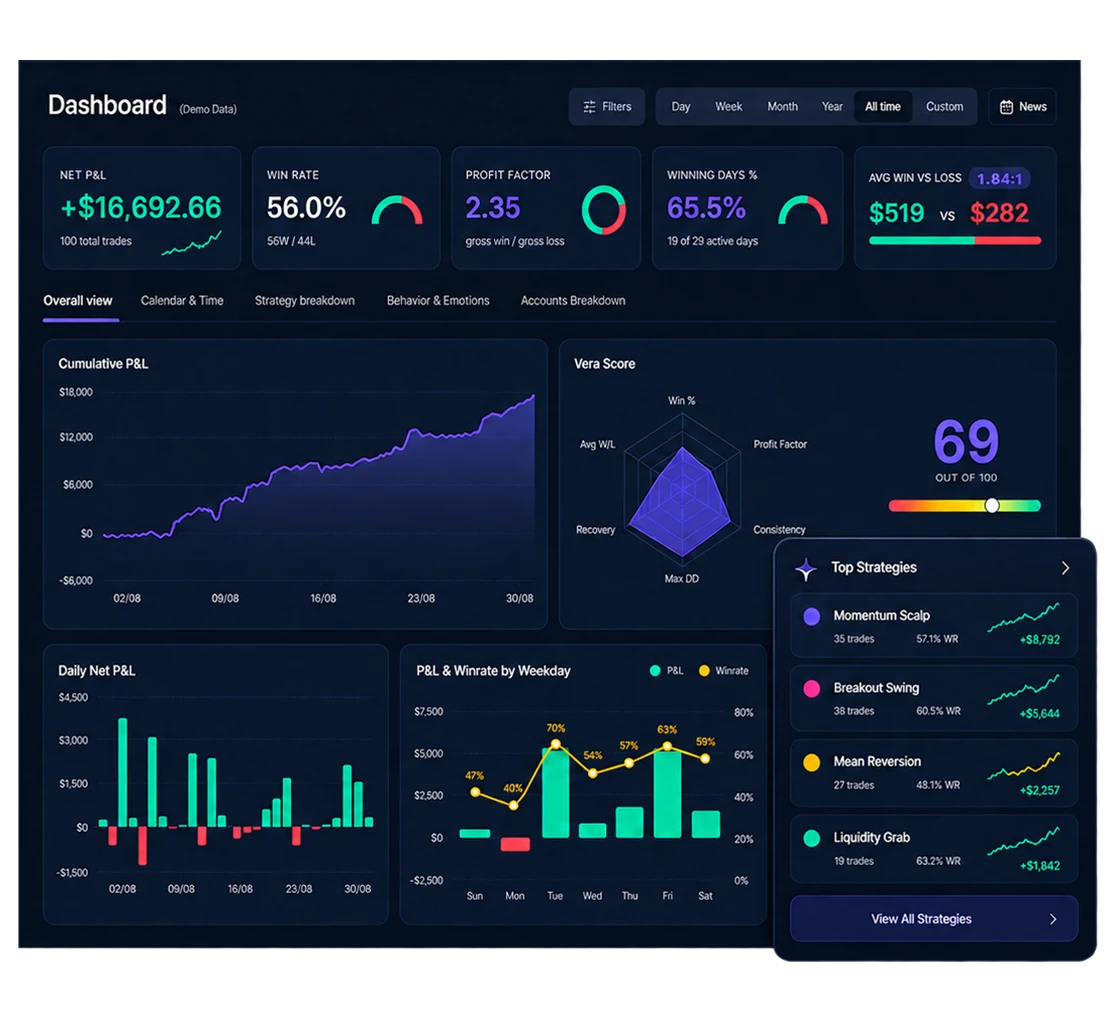
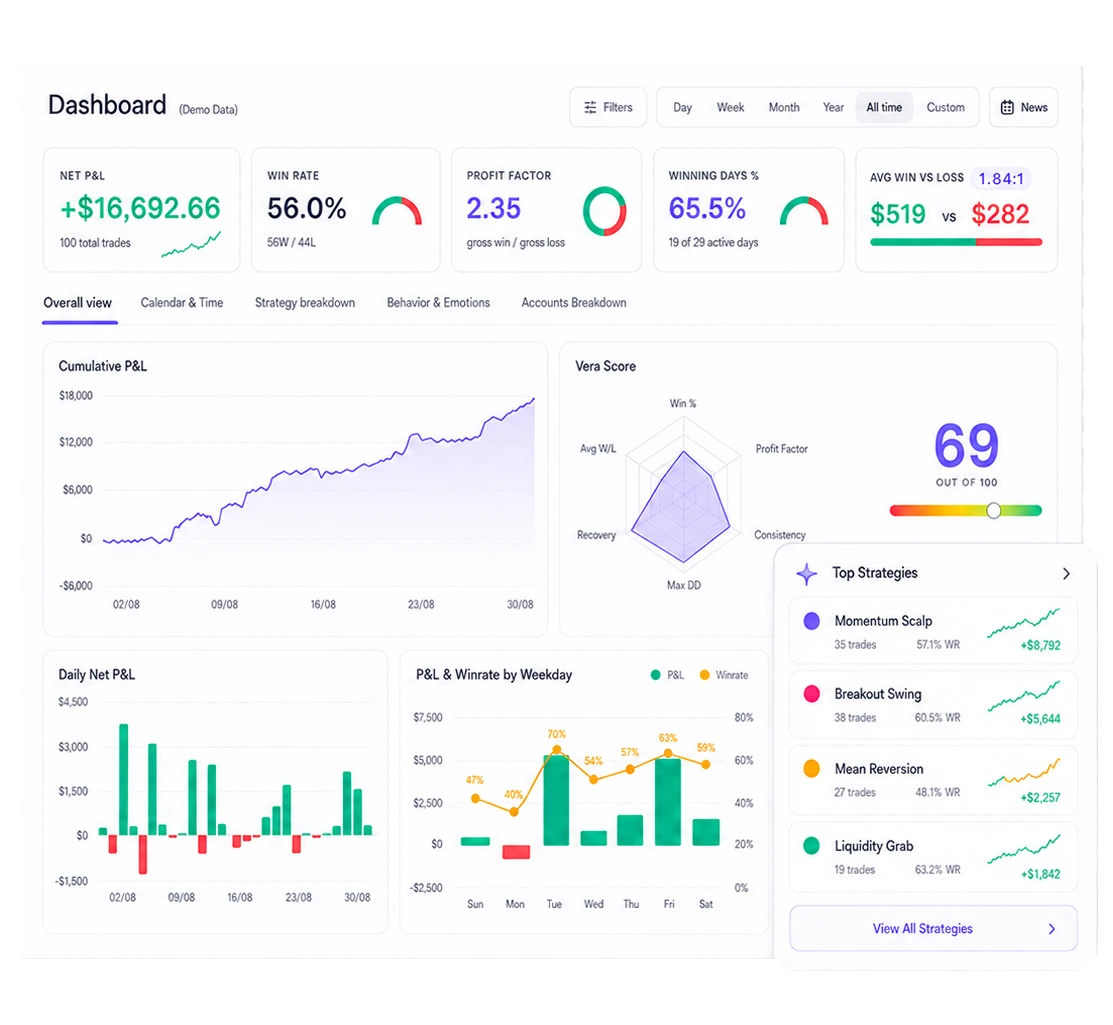
Dashboard Mock Data
Net P&L
+$7,121.32
50 total trades
Win Rate
58.0%
29W / 21L
Profit Factor
1.87
gross win / gross loss
Winning Days %
56.0%
14 of 25 active days
Avg Win vs Loss
$528vs$390
Cumulative P&L
$10.5k$7k$3.5k$0−$3.5k27/0405/0513/0521/0526/05
Vera Score
Win %Profit FactorConsistencyMax DDRecoveryAvg Win
53
OUT OF 100
Daily Net P&L
$3k$0−$1.5k
Active Emotions
Calm
+$3,410
Fearful
+$1,280
On Tilt
−$1,890
Auto Sync & Import
MT5
MetaTrader 5
N
NinjaTrader
TV
Tradovate
cT
cTrader
CSV
Any CSV format
From journal to edge lab

tradovera doesn't just record what happened.
It helps explain why it happened.

Every data point in tradovera connects to every other. Your trades link to your models, your models link to confluences, your confluences link to behavior and timing.

Trade Journal
Trading Models
Checklist Rules
Confluence Testing
Behavior & Emotions
Timing Patterns
Account Performance
Probabilistic Simulations
Confluence Lab — Signature Feature

Find the confluences that actually create your edge.

Your strategy's checklist rules become testable confluences. Select any combination and run the test — tradovera shows exactly which conditions produce edge and which are noise.

Asia Liquidity Sweep — strongest edgeBody stop loss — avoidFVG — high synergy
Strategy Model
Asia Liq. Sweep6 STEPS
P&L
+$18.7k
Win Rate
71%
Execution Checklist
Asia High/Low Liquidity Sweep
Fair Value Gap (FVG)
5-minute timeframe entry
1-minute timeframe entry
Wick stop loss
Body stop loss
📊 Deep Analysis →
SELECT CONFLUENCES2 selected
Asia High/Low Liquidity Sweep
85% · 20tr
Fair Value Gap (FVG)
78% · 18tr
5-minute timeframe entry
72% · 25tr
1-minute timeframe entry
68% · 22tr
Wick stop loss
61% · 23tr
Body stop loss
38% · 21tr
Asia Liquidity SweepFVG
Strong edge
Trades
11
9W - 2L
Net P&L
+$8,240
Win Rate
91%
Avg R:R
3.14
Profit Factor
8.6
Expectancy
+$749
Equity Curve
T1T2T3T4T5T6T7
SortBy
Edge score
Best – worst
Individual
confluence
performance
ConfluencePerformance BarTradesWin RateNet P&LEdge
Asia High/Low Liquidity Sweep
2085%+$11,400A
Fair Value Gap (FVG)
1878%+$9,200A
5-minute timeframe entry
2572%+$7,800A
1-minute timeframe entry
2268%+$5,600B
Wick stop loss
2361%+$3,200B
Body stop loss
2138%−$2,800D
Strategy Breakdown

Stop guessing which setups deserve capital. Test them.

Define your trading models with step-by-step execution checklists, then measure performance across every confluence and condition. Evidence over intuition.

Compare all models by net P&L, win rate, and avg R:R
Define execution checklists — VWAP, volume, HTF trend, retest, RSI
Measure performance per confluence combination, not just per trade
Mini equity curve for the last 10 trades — see which models are trending
For discretionary traders who want evidence, not vibes.Know which setups deserve more capital and which ones should be refined or removed.
Strategy breakdown
50 total trades
StrategyWin RateR:RRecentNet P&L
Unknown
36 trades
47.2%
2.63
+$6,158
Mean Reversion
6 trades
33.3%
7.19
+$1,673
Breakout Swing
2 trades
100%
329.7
+$659
Momentum Scalp
6 trades
33.3%
0.48
−$1,530
The Hard Truth

Excel sheets don't build better traders.

Logging columns of numbers is admin work. It doesn't validate setups, isolate mistakes, or filter the psychological noise that actually destroys accounts.

01Edge Validation

You believe a setup works, but you have never statistically verified it.

❌ Excel Sheets

Your edge remains a hypothesis. You trade on conviction and hope, not mathematical proof.

⚡ tradovera Way

A statistical edge engine translating discretionary executions into quant-level playbook metrics automatically.

02Behavioral Tracking

You only log execution entry and exit prices, ignoring psychology.

❌ Excel Sheets

Rule adherence, emotional state, hesitation, and execution quality are completely invisible.

⚡ tradovera Way

Correlate mental states, discipline metrics, and hesitation patterns automatically to find performance synergies.

03Risk Scaling

You increase size without understanding historical drawdown variance.

❌ Excel Sheets

Increasing risk is a pure guess. You have no idea what drawdowns are statistically normal.

⚡ tradovera Way

Run Monte Carlo simulations to see range of outcomes and maximum expected drawdowns before scaling.

04Screenshots & Logs

You save screenshots in folders where they gather dust and go unused.

❌ Excel Sheets

Patterns are left unnoticed and lessons stay invisible because images are disconnected from data.

⚡ tradovera Way

Link charts and screenshots directly to execution tags and checklist rules for instant retrospection.

05Feedback Loops

You make the same mistake over and over again without correction.

❌ Excel Sheets

Without automated alerts or structured feedback loops, toxic habits repeat infinitely.

⚡ tradovera Way

Systemized loops isolate execution leaks (e.g., FOMO, early exits) and alert you before your next trade.

Behavior & Emotions

Make psychology measurable.

Every trader knows psychology matters. Almost none quantify it. tradovera turns your emotional state into a data dimension — giving you hard numbers you can actually act on.

Tag each trade with emotional state — win rate and R:R per emotion
Confidence matrix: does your high-conviction actually outperform?
Rule adherence vs rule-breaking P&L — see what discipline costs you
Behavior Score out of 100 — benchmark your consistency over time
On Tilt
50% WR · 0.23 R:R · −$1,034
When Calm
67% WR · 1.57 R:R · +$513
Behavior & Emotions
All time
Behavior
56
Discipline
44%
Emotional
55%
Rule Adhr.
69%
EmotionWin RateAvg R:RNet P&L
Confident
3 trades
33% 1W/2L
10.22
+$1,518
Calm
3 trades
67% 2W/1L
1.57
+$513
Fearful
2 trades
50% 1W/1L
3.16
+$288
Anxious
1 trade
100%
+$177
Tilt
2 trades
50% 1W/1L
0.23
−$1,034
Calendar & Time

Know when your edge is strongest — and when to stop.

Time is a hidden variable in every trade. tradovera maps your P&L across hours, days, and weeks so you know exactly when your setups perform and when they don't.

Color-coded profit and loss days at a glance
Weekly P&L totals with active day count in the side panel
Win rate and net P&L by day of the week and time of day
Find your best sessions — and know when to close the terminal
Trading Calendar
May 2026
May 2026
Net: +$6,960.64
S
M
T
W
T
F
S
26
27
−$148
28
+$833
29
−$330
30
−$112
1
+$537
2
3
4
−$112
5
−$198
6
−$123
7
+$779
8
+$48
9
10
11
+$686
12
−$589
13
+$428
14
15
17
18
19
+$237
20
+$1,213
21
+$2,634
22
+$298
23
24
25
−$237
26
Week 1 · 1 active day+$537.45
Week 2 · 6 active days+$738.09
Week 3 · 5 active days+$1,538.06
Week 4 · 4 active days+$3,415.07
Week 5 · 3 active days−$789.61
Trades Journal

Every trade, enriched and visual

Review your trades in Card View — see the chart, side, strategy tag, and P&L at a glance. Switch to List or Calendar anytime.

List, Card, and Calendar views for your trade log
Tag trades with model, emotion, and conviction level
Add real chart screenshots and review notes per trade
Trades Journal
Manage and enrich your trade log
NASDAQ MACRO TIME
18,23418,22618,21918,21118,204ENTRYTP TARGETSL
MNQSHORT
May 20, 10:50
Net P&L
+$500.00
iFVG
18,20318,19718,19018,18418,178ENTRYTPSTOP HIT
MNQSHORT
May 18, 10:58
Net P&L
−$1,000.00
NASDAQ MACRO TIME
18,15318,14518,13818,13018,123ENTRYTP TARGETSL
MNQLONG
May 18, 10:50
Net P&L
+$500.00
NASDAQ OPEN 9:33
18,12218,11418,10618,09818,089ENTRYTP TARGETSL
MNQSHORT
May 18, 10:33
Net P&L
+$500.00
ASIA LIQ SWEEP
18,14018,12318,10718,09018,074ENTRYTP TARGETSL
NQLONG
May 17, 14:15
Net P&L
+$1,200.00
5MIN FVG
5,2165,2125,2085,2045,200ENTRYTPSTOP HIT
ESSHORT
May 17, 10:10
Net P&L
−$450.00
SESS LIQ SWEEP
2,3632,3552,3482,3402,333ENTRYTP TARGETSL
GCLONG
May 16, 09:45
Net P&L
+$800.00
NY OPEN SWEEP
7,8587,8457,8337,8207,808ENTRYTP TARGETSL
CLSHORT
May 15, 11:20
Net P&L
+$650.00
iFVG
18,05518,04618,03718,02818,019ENTRYTPSTOP HIT
MNQLONG
May 15, 09:55
Net P&L
−$300.00
LOND CLOSE
39,12439,11139,09739,08339,069ENTRYTP TARGETSL
MYMSHORT
May 14, 15:30
Net P&L
+$950.00
NASDAQ OPEN 9:33
18,30718,28318,25818,23418,210ENTRYTP TARGETSL
NQSHORT
May 14, 10:45
Net P&L
+$1,800.00
NASDAQ MACRO TIME
5,1945,1875,1795,1715,163ENTRYTP TARGETSL
ESLONG
May 13, 13:05
Net P&L
+$350.00
Vera Score

See your trading performance like a quant dashboard, not a spreadsheet.

The Vera Score rolls up win rate, profit factor, consistency, recovery, avg win, and max drawdown into a single benchmark. A quant-grade view of where you actually stand.

Updated automatically after every closed trade
Six-axis radar breakdown — no single metric hides the full picture
Instantly see your weakest dimension — and what to fix first
51
/ 100
Vera Score
Developing · May 26, 2026
Win %
46
Profit Factor
65
Avg Win
58
Consistency
56
Recovery
42
Max Drawdown
38
Accounts Breakdown

Every account. Clear performance data.

Manage FTMO, Apex, Rithmic, and personal accounts side by side. Track prop firm accounts separately, see your real combined equity curve, and never lose clarity across multiple servers.

Accounts Breakdown
3 accounts · All time

IBKR-Live

#PERSONAL-IBKR
last 10 trades
Prop firm
$105 799
Equity · started $100 000
+5.8%
+$5799
Net P&L
11
Trades
55%
Win rate

Apex-Rithmic

#APEX-50K-2
last 10 trades
Prop firm
$100 895
Equity · started $100 000
+0.9%
+$895
Net P&L
19
Trades
63%
Win rate

FTMO-Server

#FTMO-100K-1
last 10 trades
Prop firm
$99 852
Equity · started $100 000
-0.1%
-$148
Net P&L
20
Trades
40%
Win rate
Why tradovera exists

Built from both sides of the desk.

Statistical rigor from quant research. Practical clarity from real execution. tradovera was built because neither side alone produces better traders — the combination does.

📐

The Quant makes it rigorous

Statistical validation, confluence testing, Monte Carlo simulation, probability distributions, and structured evidence — not gut feel dressed up as analysis.

📈

The Trader makes it usable

Real execution workflows, emotional state tagging, execution checklists, and review loops built around how discretionary traders actually think and trade.

🔗

The product bridges both

Quant-grade analytics in a trader-friendly interface. No statistics degree required. Just your trades, your models, and a genuine will to improve.

Basic Journal vs tradovera
Basic Trading Journaltradovera
Records tradesTests trading models
Shows P&LExplains what drives P&L
Stores screenshotsMeasures confluences
Tracks win rateTracks discipline & behavior
Reviews the pastSimulates future outcomes
Organizes historyValidates your edge
For discretionary traders with repeatable setups.Prop firm traders, futures traders, forex traders, and anyone managing multiple accounts who wants to validate their edge — not just document their trades.
PRICING

Simple, transparent pricing

Choose the plan that best fits your trading journey.

Most popular
PRO
$9.99$29
per month
  • Unlimited trades
  • Full analytics dashboard
  • Up to 5 accounts
  • Live broker auto-sync
  • Behavior & Emotions tracking
  • Strategy breakdown + models
  • Vera Score
ELITE
Coming soon
per month
  • Everything in Pro
  • Unlimited accounts
  • Simulations & scenario testing
  • Position Sizer tool
  • Advanced review logs
  • Priority support
  • Early feature access
FAQ

Common questions

Does it work with my broker?
tradovera connects directly to MetaTrader 5, Tradovate, NinjaTrader, and cTrader. Any broker that exports trade history as a CSV is also supported. More integrations are added regularly.
Is my data secure?
All data is encrypted in transit and at rest. We never access your broker credentials — only closed trade data is synced. Your data is never shared with third parties.
Can I track multiple prop firm accounts?
Yes. Pro and Elite support tracking unlimited accounts. Label each account (FTMO, Apex, personal) and switch between combined or per-account analytics instantly.
What's the difference between Starter and Pro?
Starter is a free, read-only tier that allows you to explore the platform interface. To actively journal, import trades, upload screenshots, or sync with brokers, you will need to upgrade to Pro or Elite, which unlock full access to all features.
Can I cancel anytime?
Yes — no questions asked. You keep access until the end of your billing period and can always export your full trade history.
Do you support custom CSV imports?
Yes. If your broker isn't natively supported for auto-sync, you can export your trade history as a CSV file and upload it using our custom CSV mapping tool. We support mapping columns for any custom platform layout.
Can I share my playbook results or journal with others?
Yes. You can generate encrypted public links for individual trade review sheets, setup models, or your entire performance dashboard. This is perfect for sharing with coaches, prop firms, or social media while keeping your sensitive account size details private.
Is there a discount for annual billing plans?
Yes. If you select annual billing, you save over 20% compared to the monthly plan. For example, our Pro plan is $29/month billed monthly, but only $23/month when billed annually.
Do you offer a free trial?
We currently do not offer a time-based free trial. However, our free Starter tier allows you to explore the platform interface and layout before committing to a paid plan.
Can I import history from other trading journals?
Yes. We support custom data migration and offer templates to easily import your existing trade logs from popular platforms like Tradervue, Journalytix, and Edgewonk.
What assets and markets are supported?
tradovera supports futures (NQ, ES, CL, GC, etc.), forex (all major and minor pairs), crypto (BTC, ETH, etc.), and equities. If your broker tracks it, we can journal and analyze it.
Is the Vera Score calculated in real time?
Yes. Every time you log or sync a closed trade, the Vera Score algorithm automatically recalculates your performance index and updates the six-axis radar chart instantly.

Stop Guessing.
Start Validating Your Edge.

Join discretionary traders who use tradovera to prove their edge with data — not vibes.

✓ Free to start✓ Works with your broker✓ Quant-grade analytics✓ Built for discretionary traders